Graphic design has long played a pivotal role in the field of architecture, enhancing the communication between architects and their audiences. Traditionally, architectural projects relied heavily on technical drawings and blueprints, but today's diverse array of graphic design tools and techniques has revolutionized this practice. Graphic design for architects now encompasses everything from sleek project presentations to immersive digital experiences. While it might initially appear meticulous and complicated, this synergy between graphic design and architecture is both inspiring and innovative--and it's currently witnessing a significant evolution. Elevate your architectural endeavors with the following graphic design principles tailored for architects, and redefine the way you present your creative visions.
Architectural visualization
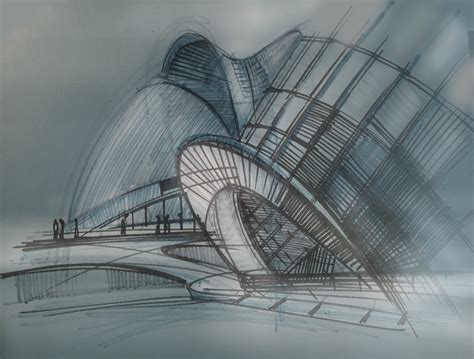
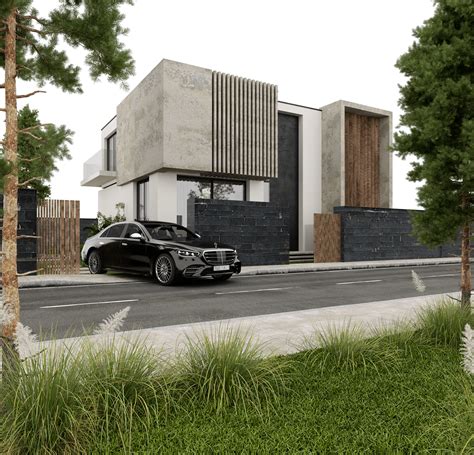
Architectural visualization stands as a crucial facet within graphic design for architects, offering a synthesized representation of potential structures and spaces through the skillful use of 3D modeling, rendering, and virtual reality tools. This immersive approach allows architects to communicate complex concepts and design intentions with unparalleled clarity, bridging the gap between abstract ideas and tangible realities. High-fidelity imagery and animations capture intricate details like light interactions, materials, and spatial dynamics, which enable stakeholders to foresee and assess the aesthetic and functional aspects of a proposed project before construction begins. By incorporating cutting-edge technologies and software, graphic designers in architecture enhance the client's or the team's understanding and approval processes, ultimately optimizing the decision-making trajectory and fostering a collaborative environment.
Site analysis graphics
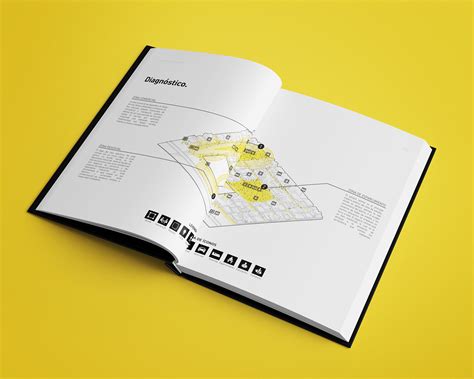
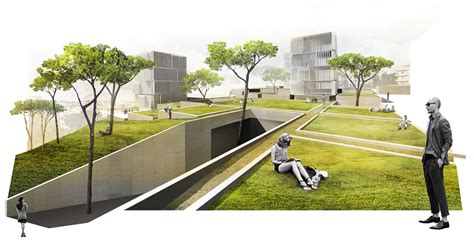
Site analysis graphics serve as an indispensable tool for architects, providing a meticulous visual comprehension of a proposed project site's inherent opportunities and constraints. These graphics often incorporate topographical maps, sun path diagrams, wind rose visuals, and context maps detailing existing infrastructure and vegetation. By layering historical data, zoning information, and demographic statistics, architects craft a multi-dimensional narrative that guides the subsequent design process. Such graphics prove essential in communicating site considerations to clients and stakeholders, facilitating informed decision-making and crafting designs that harmonize with the natural and built environment.
Design presentation boards
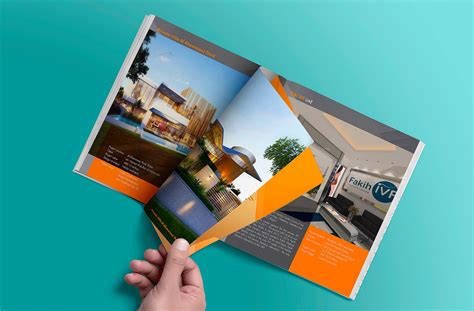
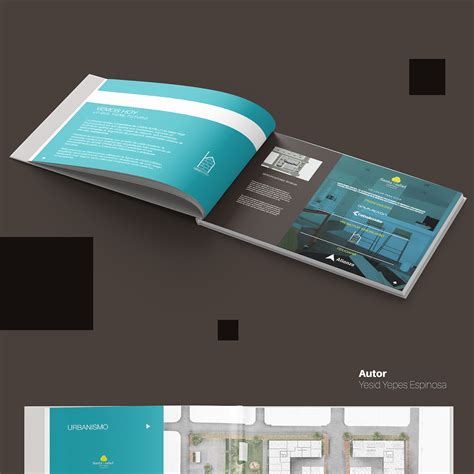
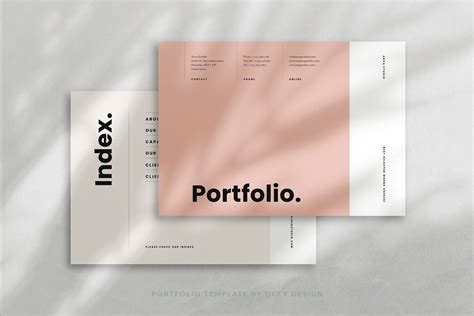
Design presentation boards for architects require a meticulous balance between technical precision and aesthetic appeal, serving as a visual narrative that conveys the essence of the architectural concept. Architects must thoughtfully curate content, integrating floor plans, elevation sketches, material samples, and contextual information within a cohesive design layout to effectively communicate their vision to clients and stakeholders. Graphical hierarchy should be employed, using size, color contrast, and typography to guide the viewer's eye across the board, ensuring that each element, such as text blocks and imagery, supports the project's concept without overwhelming the viewer. The color palette should relate to the project's thematic elements; subtle texturing and shading can enhance depth, while clarity remains paramount to ensure that the designs can be interpreted swiftly and correctly by diverse audiences ranging from technical experts to laypersons.
Conceptual diagrams
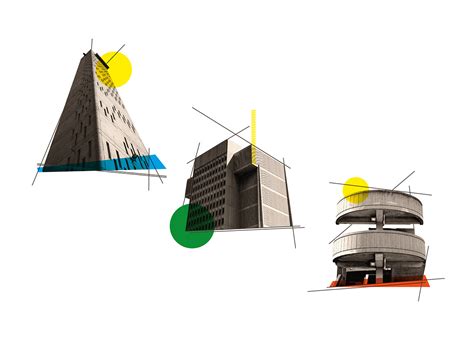
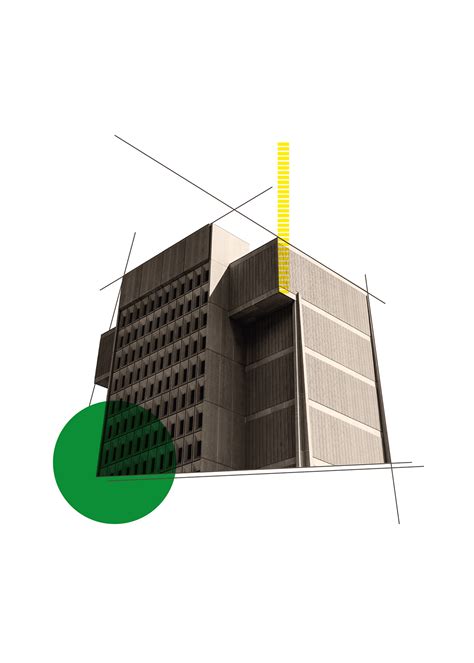
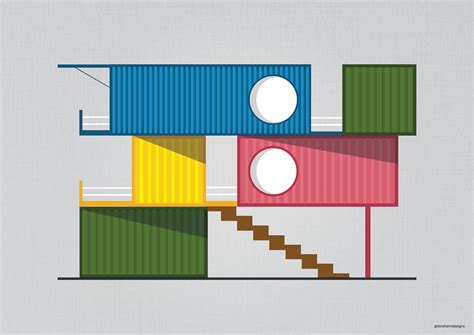
Conceptual diagrams hold significant importance in architectural graphic design as they distill complex design concepts into simple visual forms, aiding in the communication between architects, clients, and stakeholders. Architects utilize these diagrams to convey essential ideas, spatial relationships, and functional aspects of a project without resorting to excessive detail, allowing for a clearer understanding of the project's intent. The efficacy of conceptual diagrams lies in their ability to abstractly represent architectural themes, narratives, and programmatic functions, employing a language of symbols, arrows, and geometric shapes that transcend linguistic barriers. This form of graphic design, which focuses on the essence rather than the specifics, can be pivotal in the early stages of design development and during presentations, ensuring that the core concept is effectively communicated and remains central throughout the design process.
Rendered floor plans
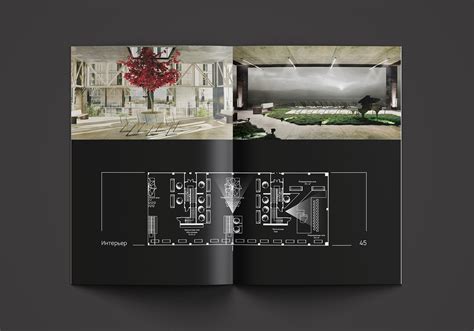
Rendered floor plans in graphic design for architects capitalize on the intricate balance between aesthetics and functionality, creating visually compelling and highly informative illustrations. By incorporating advanced software tools such as AutoCAD, SketchUp, and Photoshop, these plans go beyond basic black-and-white line drawings, integrating textures, vibrant colors, and complex shading techniques to mimic real-world materials like wood, marble, or concrete. The process involves creating photorealistic representations of interior and exterior spaces, enabling architects to present a clear vision of spatial arrangements, material choices, and design intentions to clients, stakeholders, and potential buyers. Through careful consideration of light sources, shadow play, and perspective, rendered floor plans not only serve as effective communication tools but also ignite imaginative possibilities, bridging the gap between conceptual ideas and tangible architecture.
Architectural infographics
Architectural infographics are essential tools for architects to effectively communicate complex design concepts, spatial relationships, and technical data to clients, stakeholders, and collaborators. These visual representations distill intricate ideas into easily digestible graphics, employing elements such as diagrams, charts, and symbols to convey information efficiently. By integrating various data visualization techniques, infographics foster a deeper understanding of architectural proposals, enhancing the decision-making process and facilitating an engaging dialogue between architects and their audience. Moreover, these infographics can highlight sustainability features, construction timelines, and material specifications, thereby ensuring a comprehensive overview that aligns with project objectives and client expectations.
Digital model renderings
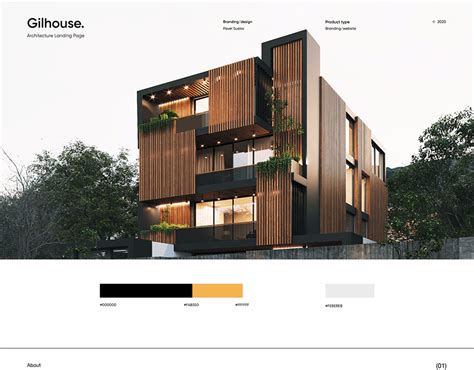
Digital model renderings in graphic design for architects are pivotal in visualizing architectural concepts with precision and realism. Utilizing advanced software tools like Autodesk 3ds Max, SketchUp, and V-Ray, architects can create detailed three-dimensional representations that integrate textures, lighting effects, and realistic materials to simulate the end appearance accurately. These renderings not only aid architects in evaluating the spatial dynamics and aesthetic subtleties of their designs but also enhance communication with clients by providing immersive, lifelike previews of projects. They further facilitate modifications by allowing designers to experiment with various design elements like color schemes and structural changes, streamlining the decision-making process throughout the development phase.
Elevation illustrations
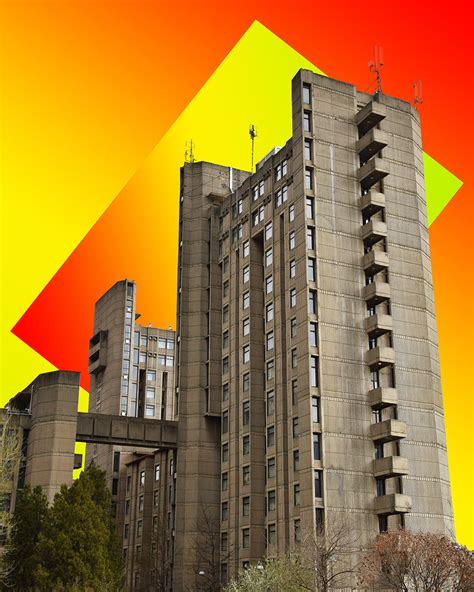
Graphic design for architects, particularly in the realm of elevation illustrations, entails creating visually compelling and technically precise representations of a building's vertical facade. Architects utilize these illustrations to communicate design intent, materiality, and spatial context, ensuring that the stylistic narrative aligns with the architectural vision while adhering to zoning and building codes. These elevation illustrations often employ nuanced shading, linework, and color palettes to emphasize depth, texture, and light interactions, effectively transforming technical drawings into an art form that resonates with clients, stakeholders, and planning authorities alike. Through the process, designers can explore and iterate on facade treatments and ornamentation, ultimately refining the architectural identity and ensuring a cohesive aesthetic that complements both the physical surroundings and the intended human experience.
Sustainable design graphics
Sustainable design graphics in architecture require a nuanced approach that intertwines aesthetics with ecological responsibility, emphasizing resource-efficient solutions. Architects can utilize green building markers, visualizing elements like solar panels, rainwater harvesting systems, and biophilic integrations through infographics, which not only educate but also persuade stakeholders of their eco-value. The importance of color schemes that mimic natural landscapes or use earthy tones becomes imperative in these designs, creating a harmonious visual dialogue that resonates with the environment, simultaneously fostering an emotional connection with the user. Advanced software tools like BIM allow designers to overlay analytical data onto the visual design, highlighting energy-efficient simulations, shading analyses, and lifecycle assessments, thus enabling a seamless blend of innovative sustainability narratives with compelling graphic design.
Zoning and massing diagrams
Graphic design for architects, particularly in the realm of zoning and massing diagrams, is a meticulous process that requires a profound understanding of both aesthetic appeal and functional representation. These diagrams serve as the foundational blueprint that outline the spatial relationships between different programmatic elements, ensuring coherence and optimization of space within urban contexts. Through the use of vector graphics, color coding, and varying levels of opacity, architects can effectively communicate complex data, such as building heights, setbacks, and density ratios, which are critical for informed urban planning and development. Precision in line weight, scale, and text hierarchy also plays an essential role in making the diagrams not only visually engaging but also legible and easily interpretable by stakeholders, facilitating smoother project approvals and stakeholder buy-in.







Leave a Reply
Your email address will not be published.