Graphic design for biology emerged as a field of its own, especially as scientific research became more visually communicative. In earlier times, scientific illustrations were primarily handmade, but now the possibilities in biological graphic design are vast. No matter the medium, this form of graphic design aims to clarify complex biological concepts and make them accessible to a broader audience. While some might initially perceive this niche as overly technical and dry, it combines precision with creativity--and is currently experiencing a remarkable evolution. Elevate your understanding with these graphic design strategies for biology and create compelling visuals that illuminate the wonders of life sciences.
Biological illustration techniques
Biological illustration serves as an indispensable tool for communicating complex biological concepts and data with precision and clarity, often employing traditional techniques that have been refined over centuries to capture the intricate details of living organisms. Artists typically rely on methods such as stippling, hatching, and cross-hatching to render textures and forms with meticulous accuracy, enabling viewers to observe aspects of structure and anatomy that may not be immediately apparent in photographs. The use of watercolor and colored pencils allows for the subtle gradation of hues, making it possible to depict the delicate coloration and translucency seen in many biological specimens. More contemporary digital techniques expand these capabilities by incorporating layers, transparency effects, and vector-based paths, enhancing the versatility and accessibility of illustrations in both print and digital media, thus continuing to push the boundaries of how biological knowledge is visualized and shared.
Scientific visualization tools
In the realm of biology, graphic design plays an instrumental role in scientific visualization, granting researchers the ability to convey complex data and intricate systems with clarity and precision. Tools such as Chimera, VMD, and PyMOL have revolutionized the visualization of biological molecules, allowing scientists to manipulate and examine molecular structures in three dimensions, thereby offering profound insights into protein-ligand interactions, molecular dynamics, and structural conformations. Complex cellular processes and genetic information can be represented through advanced infographics and bioinformatics software, such as CellDesigner and Cytoscape, facilitating exceptional comprehension and communication of cellular pathways and gene interactions by employing comprehensive visual elements that can include integrated symbols, color-coding, and interactive features. As a result, these scientific visualization tools not only enhance the aesthetic appeal of biological data but also significantly improve the accessibility and interpretability of intricate information for both professionals and lay audiences alike.
Anatomical diagram design
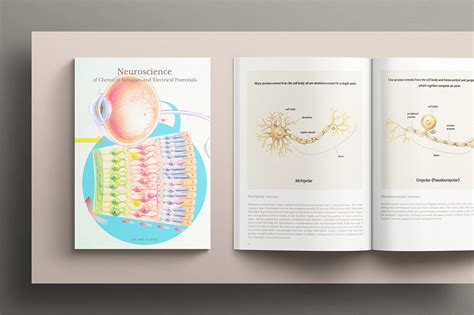
Anatomical diagram design in the realm of biology calls for precision, intricate detailing, and an in-depth understanding of the human anatomy. Designers need to expertly incorporate a combination of line work, color gradients, and shading techniques to effectively delineate various systems such as skeletal, muscular, nervous, and circulatory systems. The objective must be to create visuals that serve both educational purposes and professional medical references, necessitating an impeccable adherence to scientific accuracy and clarity. Designers often utilize advanced graphic software that supports multiple layers and high-resolution imagery, facilitating the creation of intuitive labeling and the seamless integration of interactive elements for digital platforms, thereby ensuring each diagram not only informs but also engages the viewer.
Infographic representation of ecosystems
Graphic design for biology, particularly in crafting infographics for ecosystems, involves an intricate dance between scientific accuracy and aesthetic clarity. Such infographics must translate complex data regarding biotic and abiotic components of ecosystems into visually digestible formats, showcasing the interconnectedness within ecosystems like nutrient cycles, energy flows, and trophic levels. Designers employ color coding, simplified symbols, and strategic layouts to delineate the layers of biodiversity, revealing intricate patterns such as predator-prey dynamics and mutualism within biomes, while ensuring that the visual hierarchy guides the viewer's understanding intuitively. Precision in typographic choices underscores the natural hierarchy of the ecological information, with data visualization techniques such as heat maps or flow diagrams enhancing the spatial and quantitative aspects of ecosystem interactions.
Molecular structure modeling
In graphic design for biology, particularly molecular structure modeling, the process involves an intricate blend of scientific accuracy and aesthetic presentation to visualize the complex three-dimensional architectures of biomolecules like proteins and nucleic acids. Designers employ advanced software tools such as PyMOL, Chimera, or Autodesk Maya, which are capable of rendering detailed atomic interactions and electronic configurations within molecular complexes, allowing users to manipulate structures in a virtual space for research and educational purposes. Accurate color coding and labeling are crucial in these representations, often highlighting regions of interest such as active sites or binding domains, which aid in understanding molecular function and interactions in biological systems. While maintaining scientific rigor, these visuals convey information through engaging and intuitive designs, fostering a deeper comprehension of molecular processes in both academic and corporate settings.
Habitat visualization graphics
Habitat visualization graphics in biology serve as an instrumental tool for both educational and research purposes, meticulously illustrating the complex interactions and biodiversity within ecosystems. These visualizations rely heavily on a blend of advanced software tools and artistic skills to recreate vivid, accurate representations of environments ranging from dense rainforests to vast oceanic expanses. Graphic designers in this field must possess a deep understanding of ecological principles and species-specific behaviors, ensuring each element is depicted with precision, right from the terrain's topography to the flora and fauna inhabitants. Meticulous care is directed towards integration of data analytics with aesthetic elements, enabling viewers to comprehend ecological dynamics and spatial distribution of species, as well as to appreciate the delicate balance and beauty inherent in natural habitats.
DNA sequencing graphics
DNA sequencing graphics in biology intricately merge visual aesthetics with scientific precision to communicate the complexities of genetic information effectively. Designers employ vivid color gradients to distinguish between the four nucleotide bases adenine (A), thymine (T), cytosine (C), and guanine (G), creating a vibrant palette that aids in the immediate visual interpretation of base sequences. Utilizing layered visuals and detailed texture, these designs often incorporate elements such as double helix structures, base pair alignments, and chromatograms to add depth and facilitate understanding of the sequences' spatial configurations. Tools such as vector graphics software enable the creation of scalable images which maintain clarity and precision, crucial for educational and research purposes which often demand a high level of accuracy and detail to illuminate patterns, mutations, and variances within DNA strands.
Biomechanical design schematics
Biomechanical design schematics in graphic design for biology elegantly blend the intricate artistry of nature with the precision of engineering. Detailed illustrations capture the mechanics of biological systems such as the complex locomotion of animals, mimicking muscle and skeletal interactions. Through a careful balance of aesthetics and function, these schematics reveal the hidden architecture of life, translating organic movements into cohesive visual narratives. Advanced digital tools enable designers to simulate dynamic biological processes, allowing for a deeper understanding of the evolutionary adaptations that are fundamental to biomechanical efficiency.
Cellular process visualization
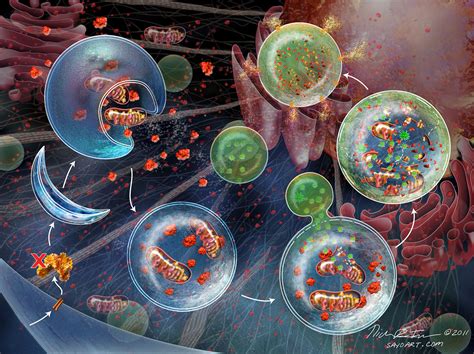
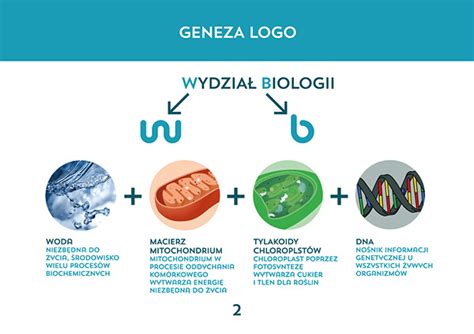
Cellular process visualization in graphic design involves creating intricate and accurate representations of the complex interactions and functions occurring at the cellular level, thereby aiding both educational and research fields. Designers employ a multitude of tools, from 3D modeling software to bioinformatics platforms, to meticulously render cellular structures such as mitochondria, ribosomes, and endoplasmic reticulum, and visualize dynamic processes like protein synthesis, cellular respiration, and mitosis. This meticulous depiction demands a deep understanding of both artistic techniques and biological knowledge to ensure scientific accuracy while maintaining an engaging and comprehensible visual narrative. These visualizations serve critical roles in elucidating difficult-to-comprehend cellular phenomena for students or conveying new research findings in scientific publications, assisting in bridging the gap between complex biological data and its human understanding.
Evolutionary biology illustrations
In the realm of evolutionary biology illustrations, graphic design plays a critical role in transforming complex scientific concepts into visually comprehensible narratives. Vibrant infographics dissect the tree of life, showcasing phylogenetic relationships between species, while meticulously detailed diagrams highlight morphological changes across geological epochs. Designers employ a spectrum of techniques, from realistic renditions that capture the intricate patterns of feathered dinosaurs to abstract representations that convey genetic mutations at a molecular level. Skillful integration of color theory and spatial arrangement ensures that these visuals not only educate, accentuating the selective pressures and adaptive strategies of organisms, but also engage an audience varied in scientific literacy.






Leave a Reply
Your email address will not be published.